What is this template?
We then aggregate and group information by prompting our data agents, and create visualizations breaking down:
- Who are your power users, and what features do they use most heavily
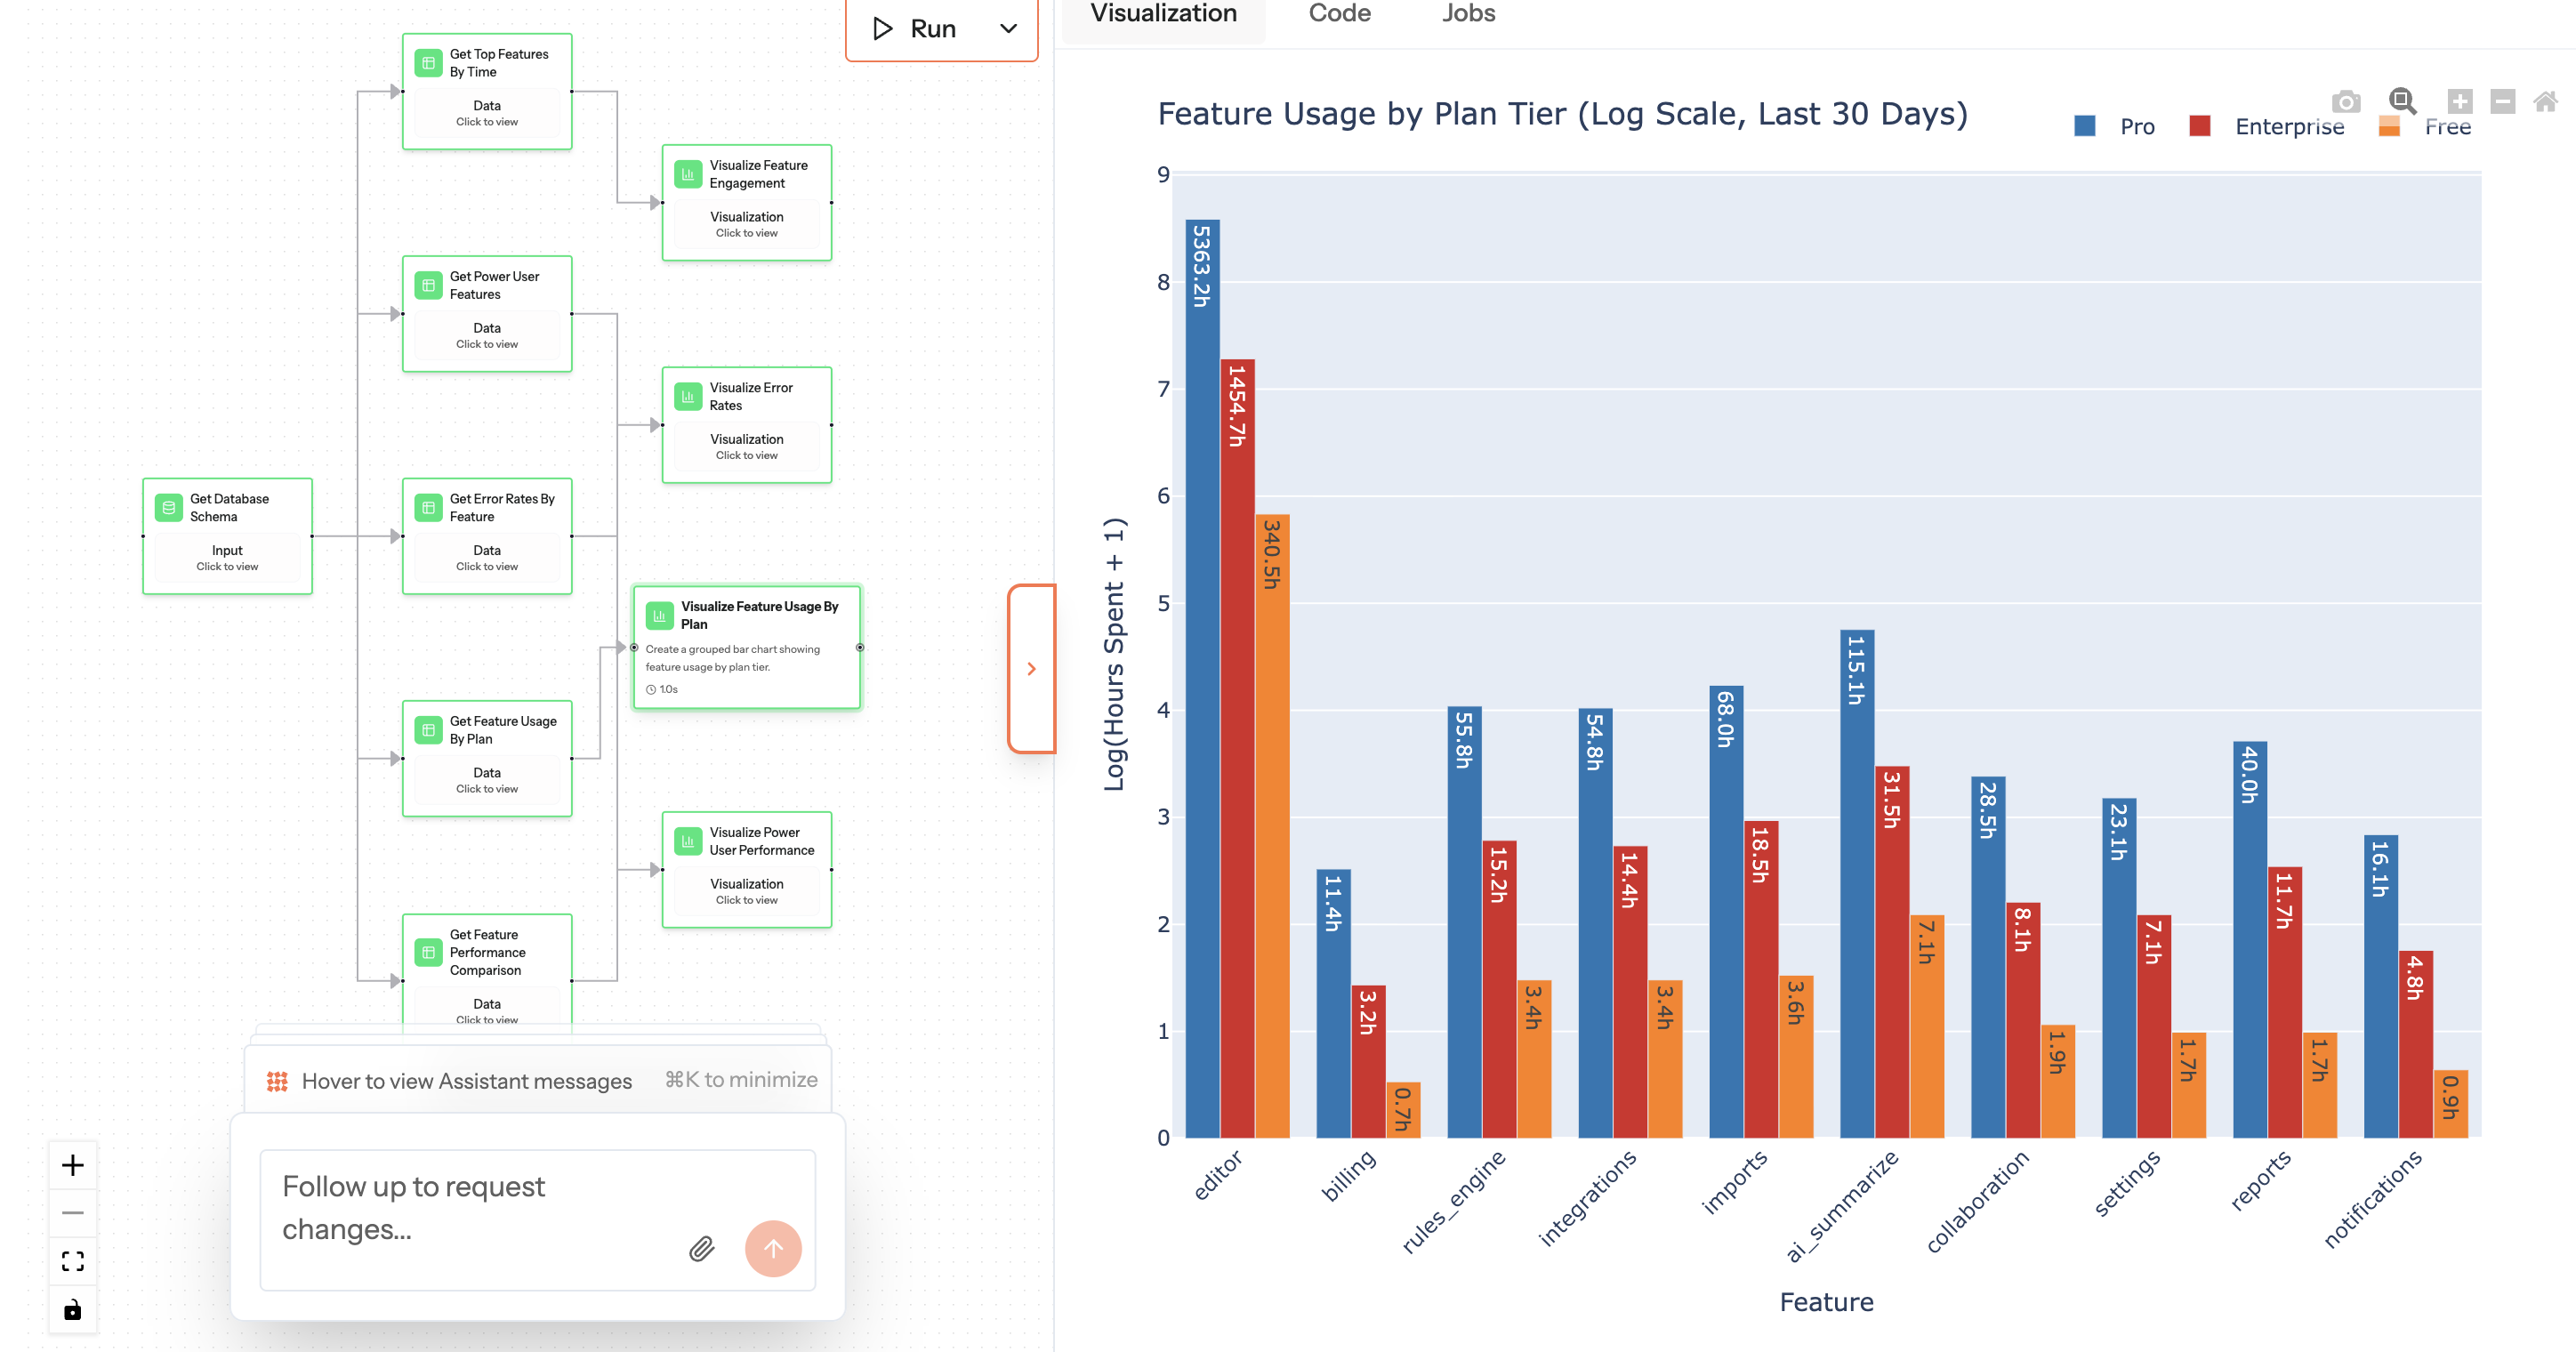
- Features by plan tier, to measure what your highest paying customers derive the most value from
- Error rates across features, to give insight in what needs fixing, and help you prioritize your sprints